Zscaler Blog
Get the latest Zscaler blog updates in your inbox
SubscribeStep Into the Future of ZDX with 3 Exciting New Features: ZDX Copilot, Data Explorer, and Hosted Monitoring!

Many organizations face challenges supporting a distributed workforce, and pressure on IT resources continues to increase. Zscaler is relentlessly focused on enhancing our Digital Experience platform to empower IT operations and service desk teams to deliver the best end user experiences for their distributed workforces.
Not long ago, we announced an ML-based Root Cause Analysis feature that helps IT teams quickly discover the root cause of issues. Using AI and ML for precise issue detection and root-cause analysis helps teams swiftly resolve support tickets by reducing mean time to resolution (MTTR) and mean time to detection (MTTD).
We’re very excited to introduce three new advancements that will further assist IT teams in improving efficiency, visibility, and collaboration across IT operations, service desk, and security teams.
ZDX Copilot: Revolutionizing IT Operations with AI
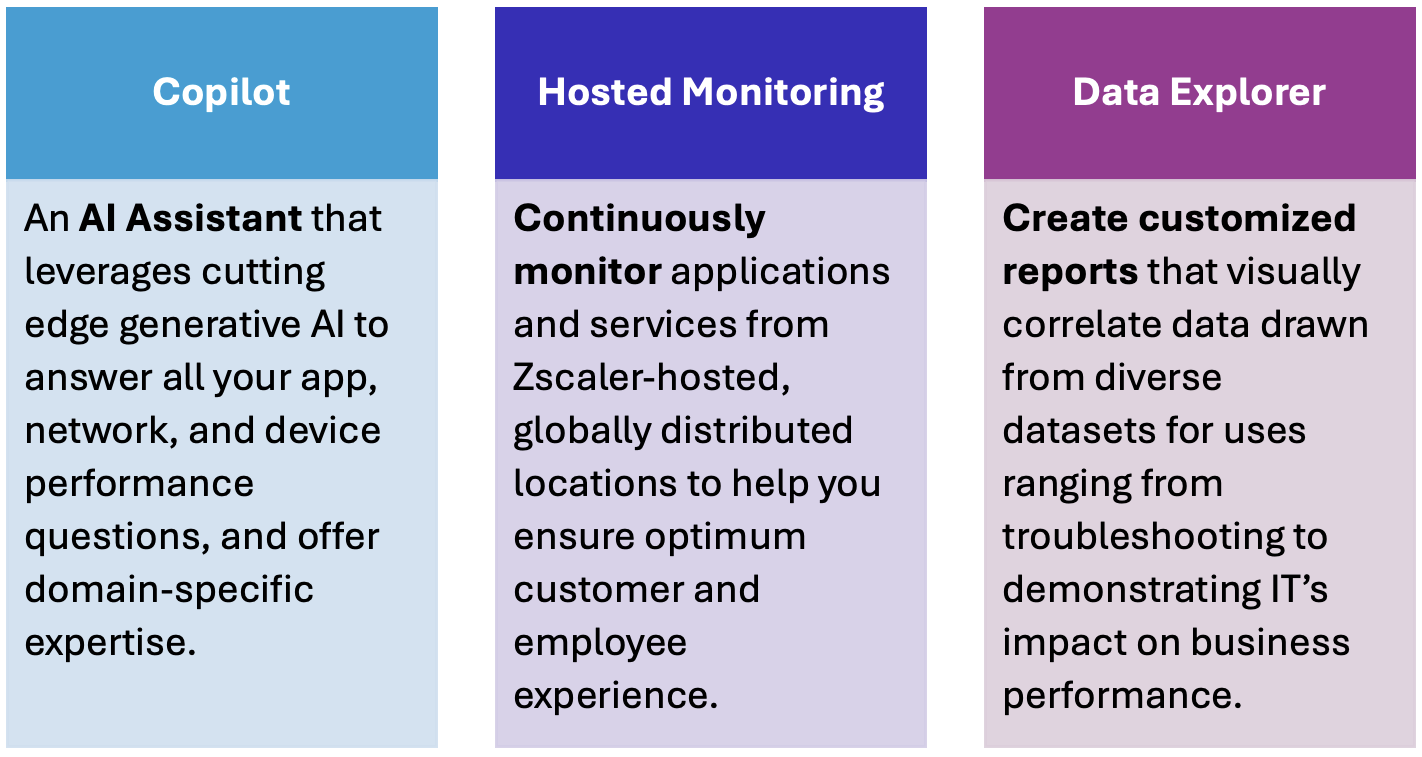
The ZDX Copilot is an AI-driven virtual assistant designed to simplify and enhance IT operations through an advanced conversational interface. By integrating AI into the core of our network operations tools, ZDX Copilot allows users to interact with their systems using natural language.
ZDX Copilot taps into the power of pre-trained LLMs to provide a conversational interface and interpret questions within the context of ZDX.
“Show me the user experience for Hiren”
Copilot links symptoms (e.g., network drops) to potential causes (Wi-Fi issues, network latency, etc.) and leverages historical data to enable accurate diagnostics.
The large language model (LLM) uses input from time series data like the web probes, CloudPath probes, device events, process stats, and hundreds of other time-series metrics to help with the analysis.
How It Works
The IT admin initiates the conversation with the Copilot: "Could you please look at this user and find out the root cause of the bad score?" The LLM then collaboratively examines the data from various angles, asks clarifying questions if needed, and provides its analysis.
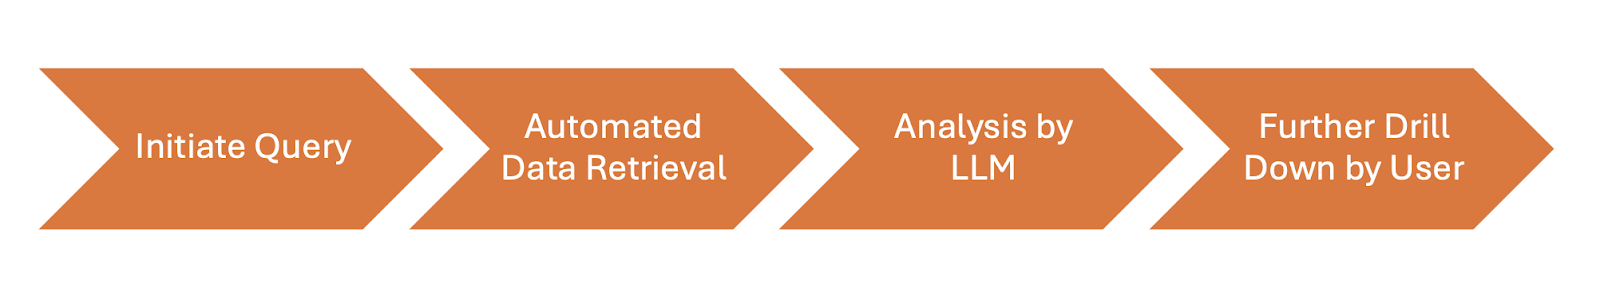
Copilot Workflow
Initiated Query: An IT admin starts the analysis by asking the LLM (in natural language) to analyze a particular data point. For instance, "Why is John Doe having poor sharepoint experience?"
Automated Data Retrieval: The system fetches the data pertaining to the query (in this case for the specific user John Doe) and presents it to the LLM.
Analysis by LLM: The LLM processes the data and provides the output/analysis to the ZDX admin.
Drill Down: The admin can further ask the LLM to drill down into specifics. For example, "Tell me more about the network slowness observed.”
Here are a few examples of the types of questions an ZDX admin could ask the Copilot:
"Which users are having a poor Wi-Fi experience?"
"Show me John Doe’s CPU utilization"
“Troubleshoot the user experience for Linda Lucas”
Let’s go through an example:
I am asking ZDX Copilot to troubleshoot my user experience: “Troubleshoot Vikas Srivastava’s experience for the last 24 hours”
Since in this case I have two devices; Copilot asks me about the device I would like to run the troubleshooting for.
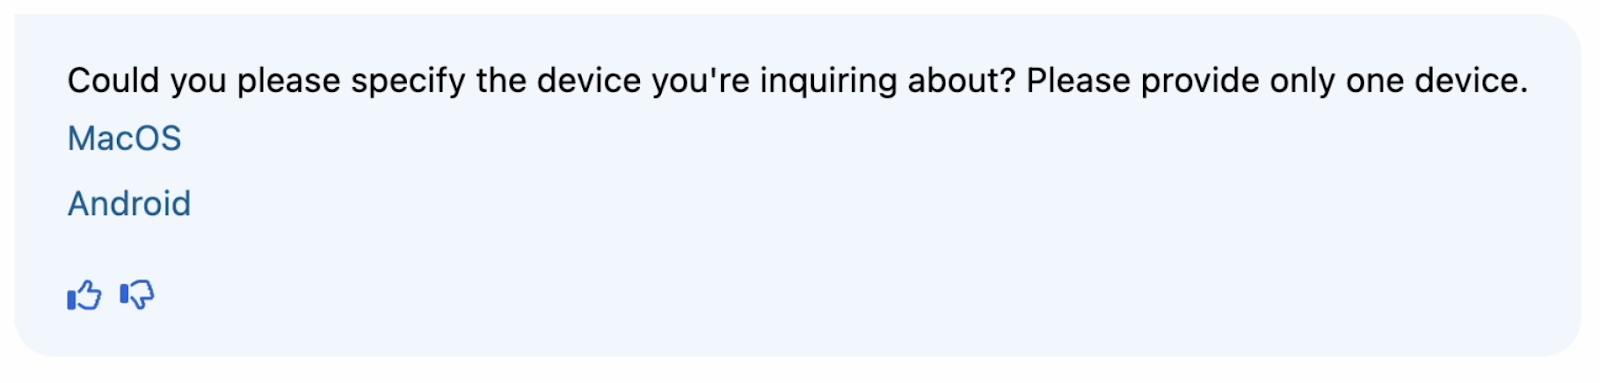
After that, it fetches the data from ZDX and provides a detailed analysis of the user experience for me and outlines possible causes that could be impacting my ZDX score.
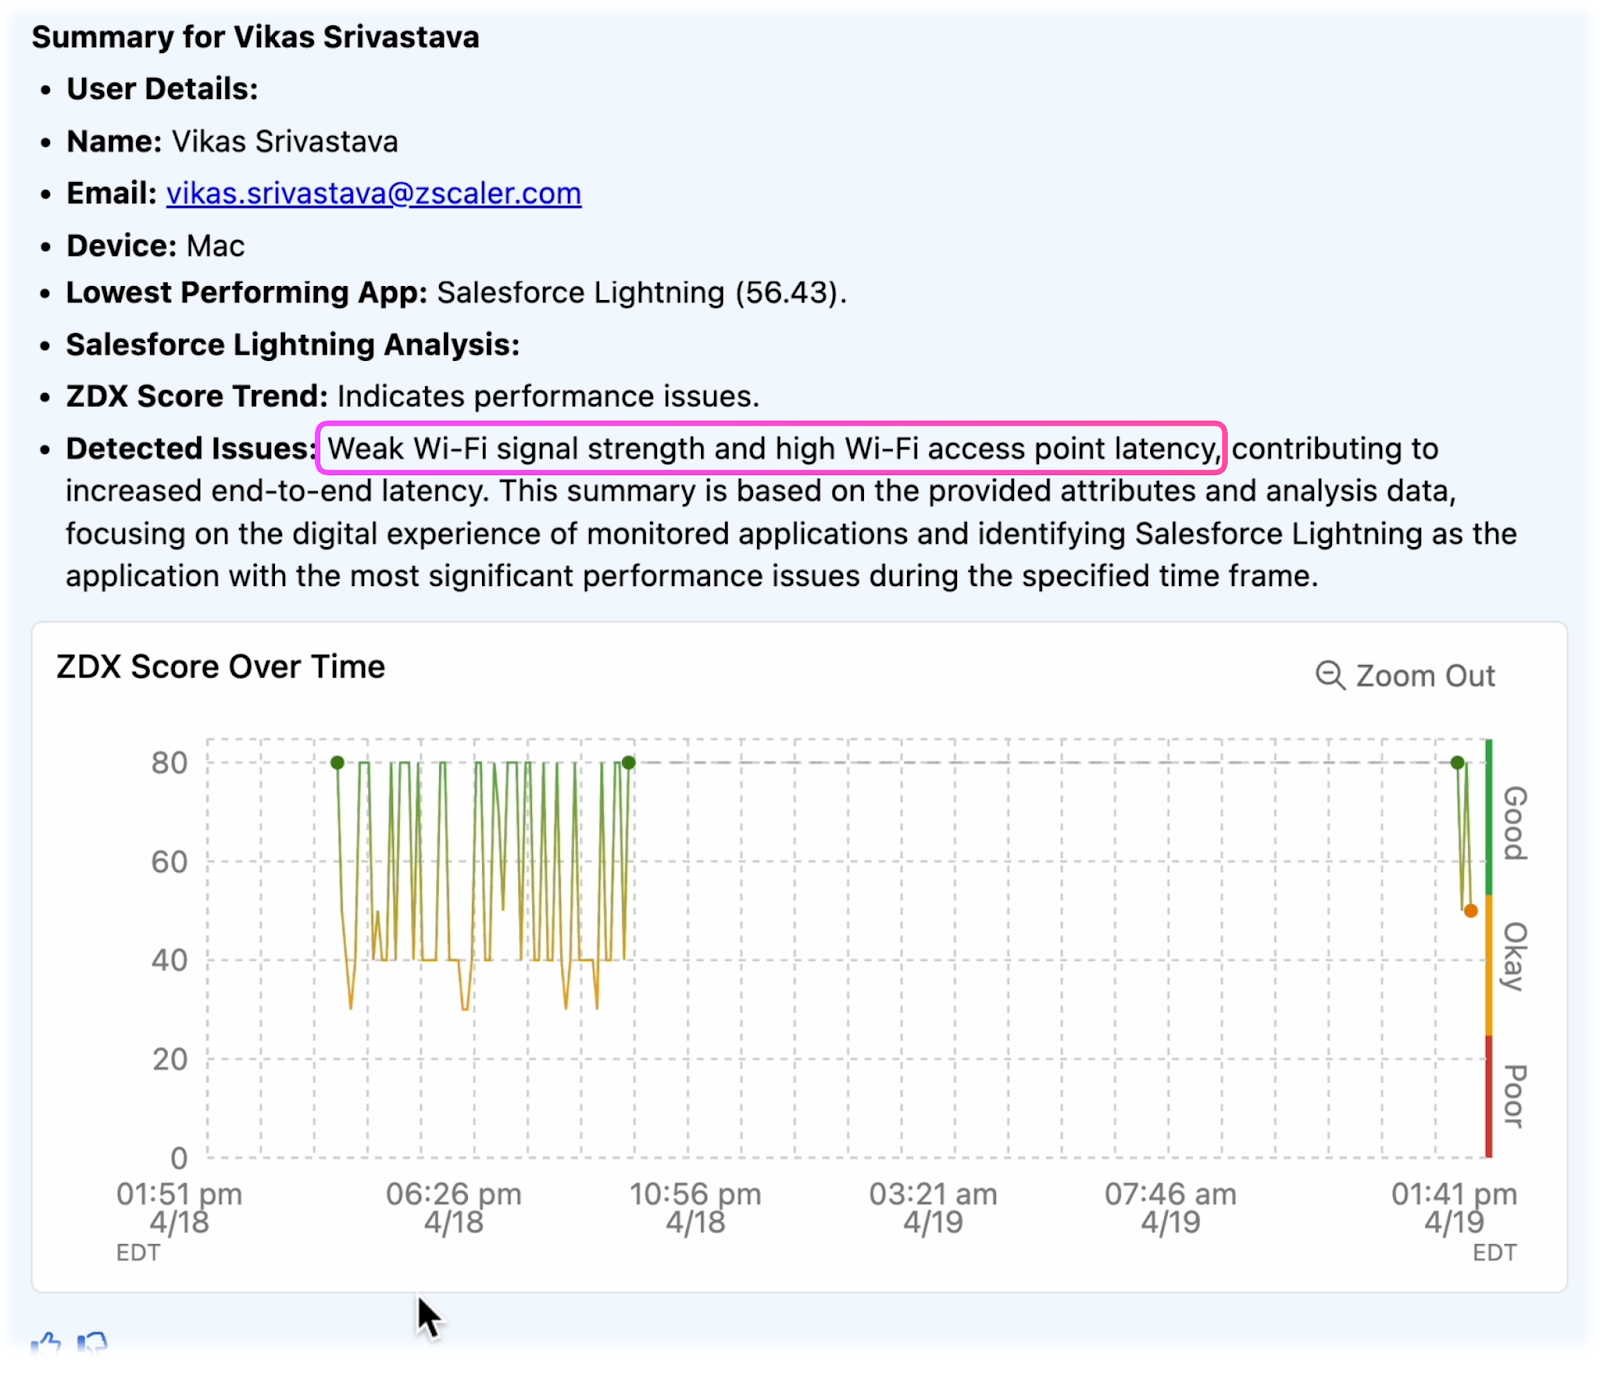
From here, I went to the ZDX user details page to search for the issue impacting my Wi-Fi. In doing so, I can validate what Copilot told me about my Wi-Fi and take remediative actions.
Now take a step back and think about how much time it took me to merely ask a question in a conversational manner to Copilot and get to the root cause of the problem. The amount of time ZDX could save for your IT teams and helpdesk is substantial.
Take a look at this analysis we did on the financial savings it could provide to you.
https://info.zscaler.com/resources-white-papers-calculating-the-financial-value-of-zdx
ZDX Hosted Monitoring: Continuous Network Performance Monitoring
Expanding on our robust monitoring solutions, Zscaler Hosted Monitoring offers a service that operates continuously across multiple vantage points worldwide. This feature is designed to monitor and benchmark network performance, providing a seamless, comprehensive overview of your network's health and activity.
Zscaler Hosted Monitoring
The Zscaler Zero Trust exchange is distributed across more than 150 data centers on six continents, enabling users to access services securely from any device, any location, and over any network. You can now monitor the performance of your business-critical and customer-facing services 24/7 from these locations.
With this continuous monitoring, you can apply:
- Application availability monitoring: Ensure that your external applications perform at their best, no matter where your customers are located
- Circuit monitoring: Ensure SLAs for applications and services you purchase from SaaS, cloud, data center, or network providers
- Performance monitoring: Confidently roll out new applications or expand into new regions as your business grows organically or by M&A
Vantage Point
A geographical location from where monitoring probes originate from. At launch, the available vantage points locations include::
- San Jose
- Washington DC
- Chicago
- Frankfurt
- Zurich
- Amsterdam
With more to be added in the future, these strategic locations ensure that Zscaler Hosted Monitoring covers a broad spectrum of the network landscape, offering diverse insights into global network performance.
Getting started with Hosted Monitoring is straight-forward
Collections: Under the Configuration section of ZDX Hosted Probes, we have Collections, a grouping mechanism for the probes you would configure for the monitored destinations. For example, you could have a collection dedicated to mission-critical applications, one for HR, another one for Finance, etc.

Hosted Monitoring Configuration
Looking at the Metrics
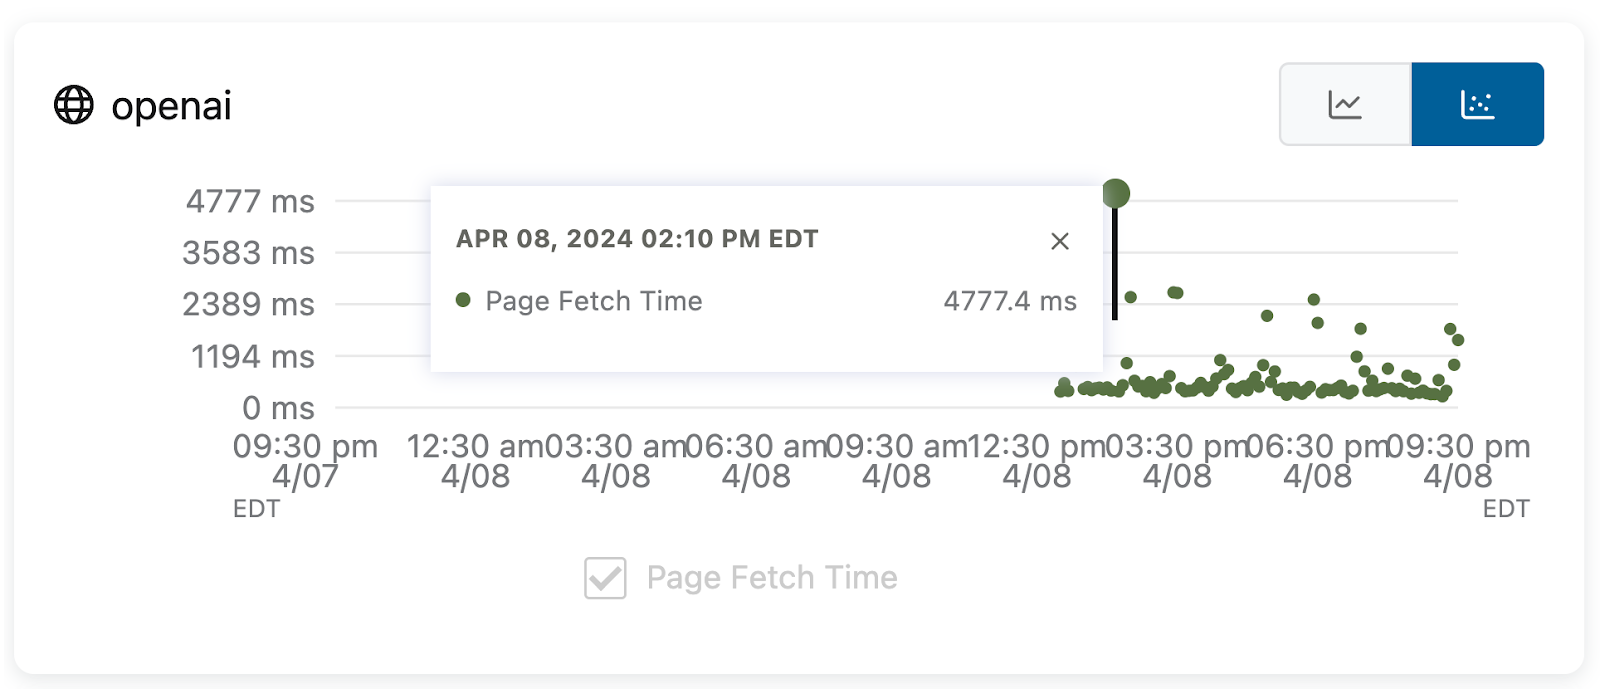
From the Zscaler Hosted Monitoring dashboard, you can analyze the time-series data collected from various vantage points. You can even select a specific vantage point of interest and see the metrics from that vantage point’s perspective.
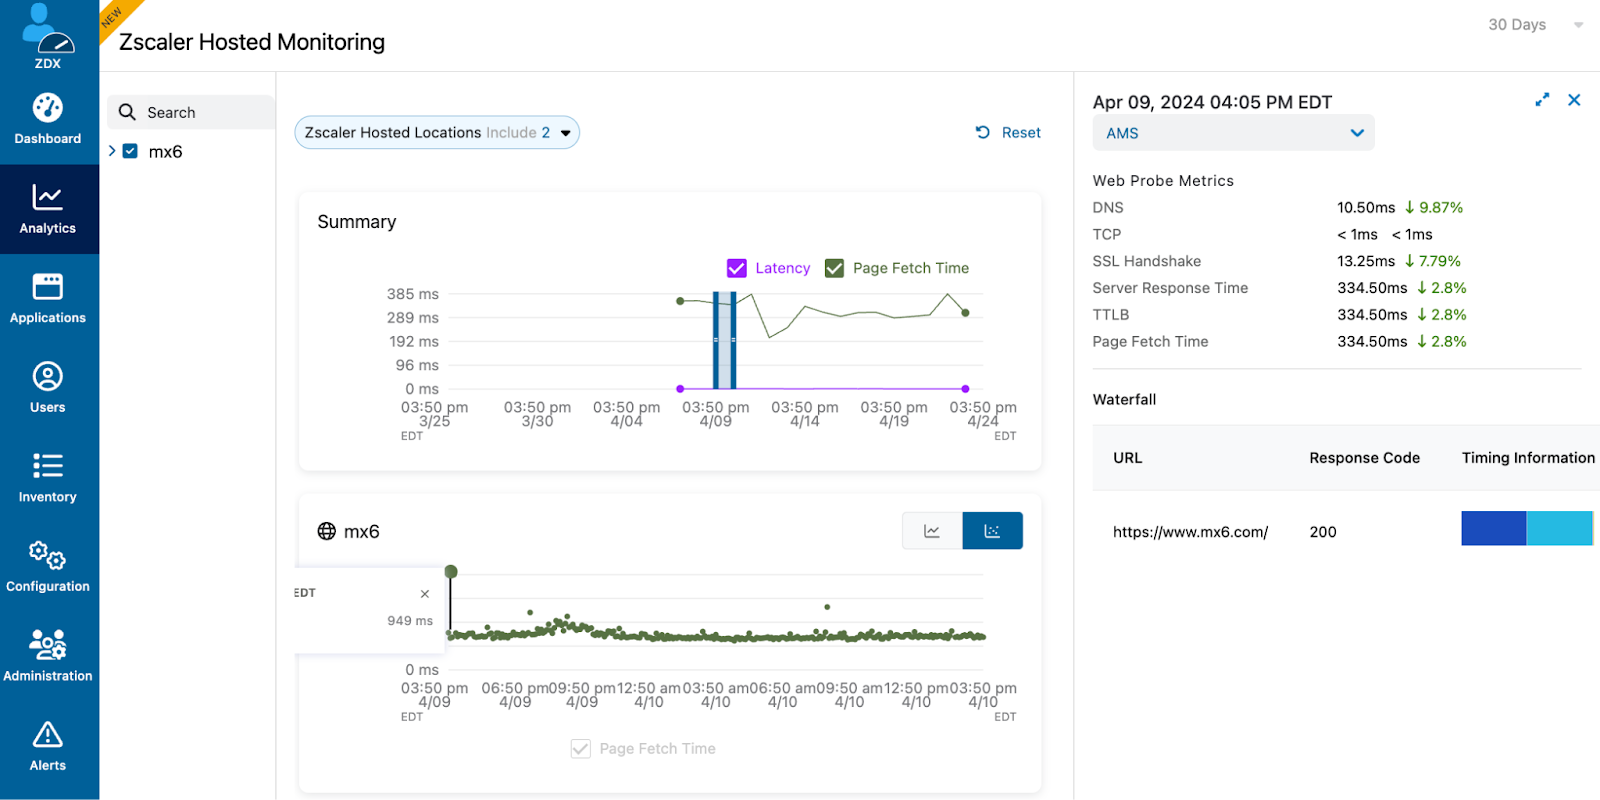
Zscaler Hosted Monitoring Dashboard
Once you select a data point on the scatter plot, you get detailed insights like DNS response times, TCP connect times, SSL handshake times, server response time, time to last byte (TTLB), page fetch time (PFT), the time series data for the web, and CloudPath along with specifics for the probe data like DNS response times.
From the waterfall details below; you can exactly see the time distribution of the different measured metrics (page fetch time, SSL handshake time, etc.) and easily understand the attribute of the page load which is taking the most time.
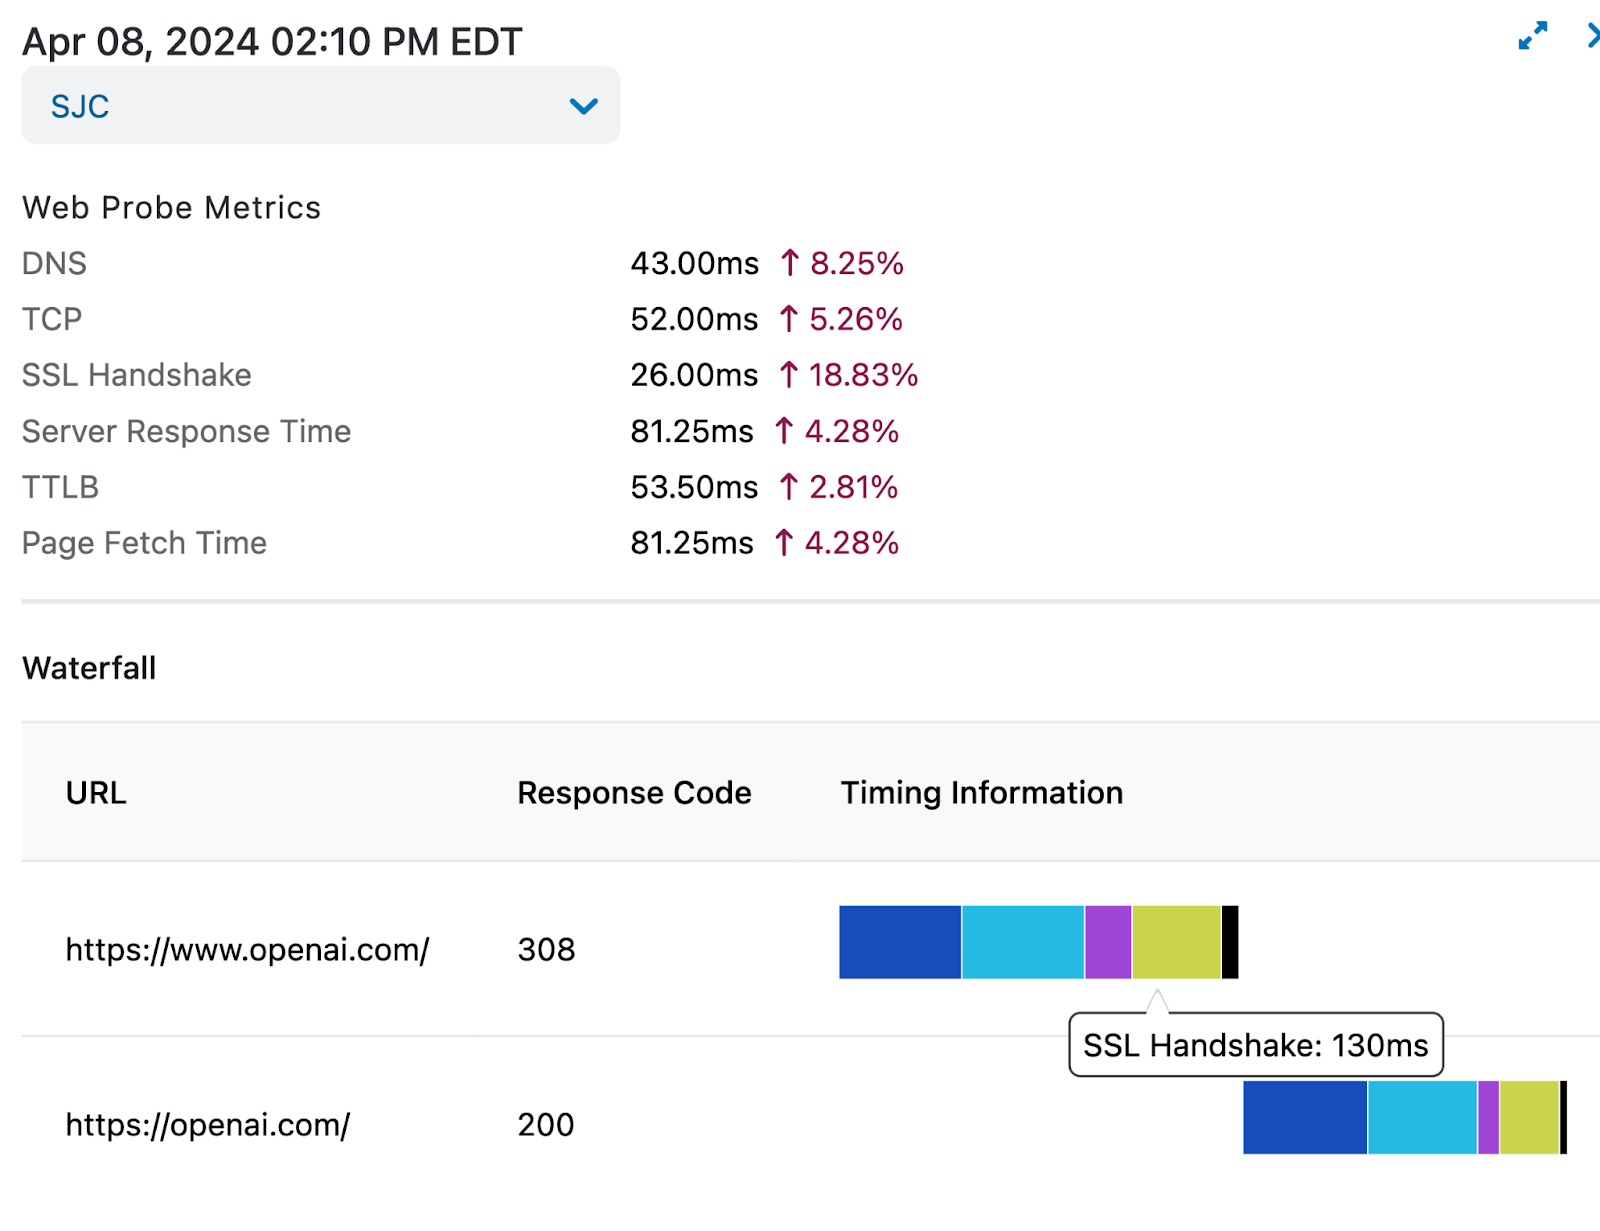
Zscaler Hosted Monitoring Metrics
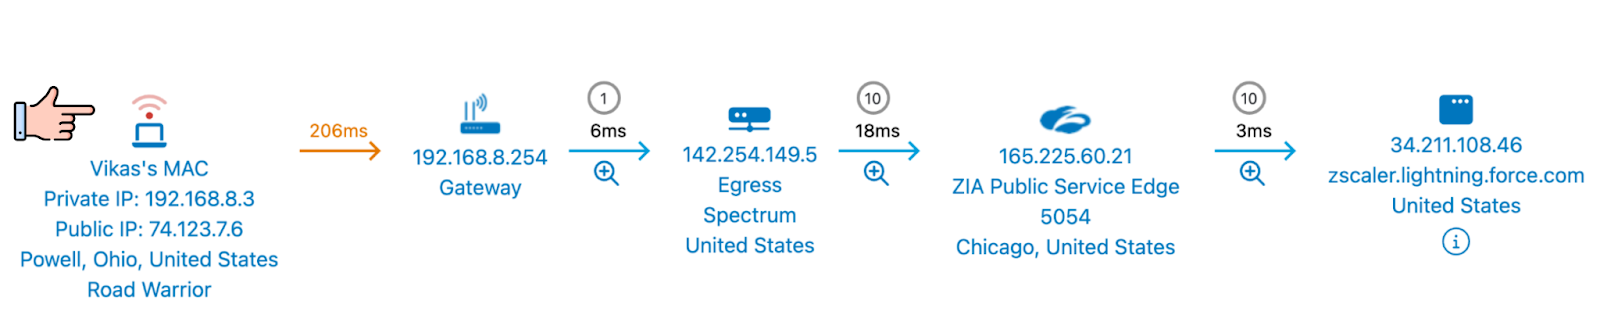
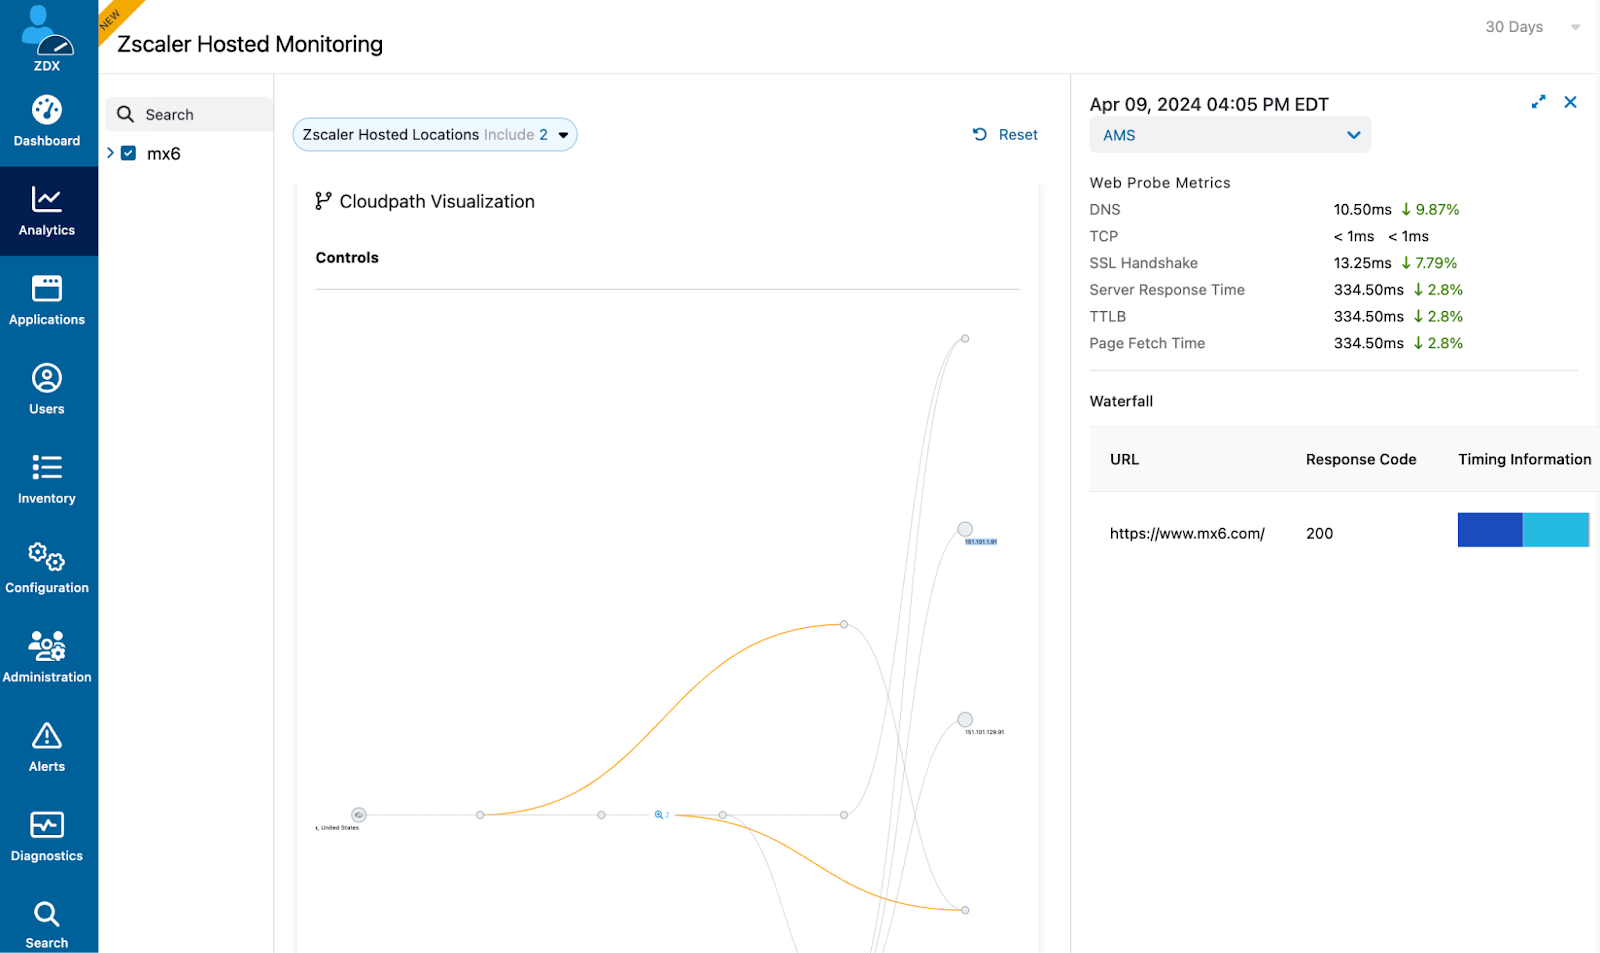
Now let's look at the CloudPath data. Below are all the ISP paths detected to the configured destination (on different DNS resolutions).
You can see the ISP information; latency between different hops to quickly pinpoint bottlenecks (highlighted in yellow).
ZDX Data Explorer: Advanced Data Querying and Reporting
ZDX Data Explorer is a sophisticated tool that enables detailed data analysis and reporting. Users can customize queries and generate reports based on various selectable fields such as applications, metrics, and grouping or aggregation preferences. This flexibility supports a detailed examination of data to uncover operational insights and trends.
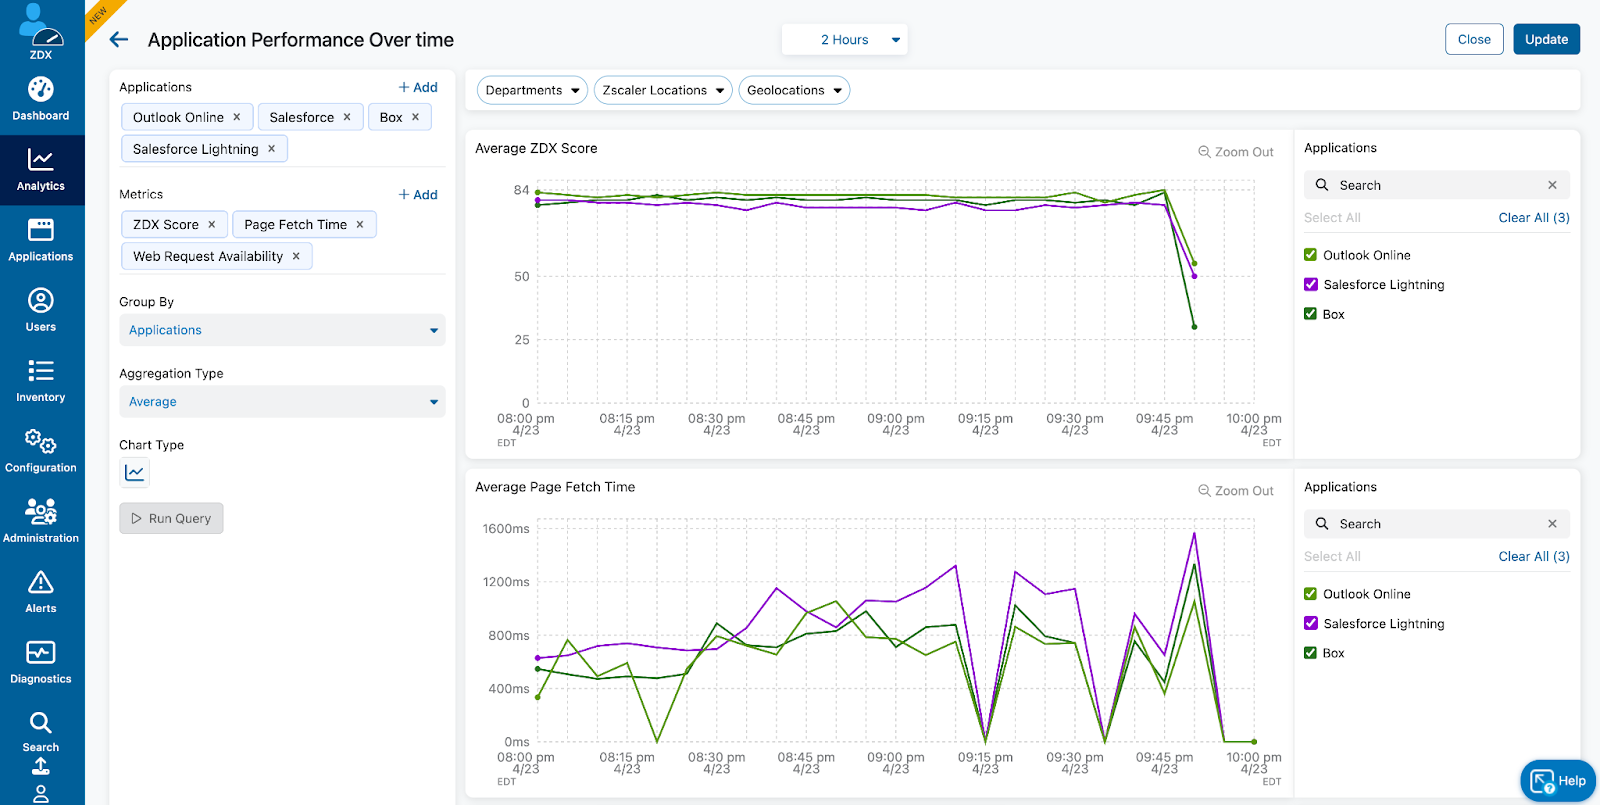
While building your query, you can select the Applications you are interested in and the specific metrics you would like to report on, such as:
- ZDX Score
- Device Count
- User Count
- DNS Time
- Page Fetch Time
- Web Request Availability
- Latency
- Packet Count
- Packet Loss
- Number of Hops
You can group these by Applications, Zscaler Locations, Geolocations, Departments
Data Explorer is valuable for engineers and managers: Engineers can troubleshoot problems by comparing similar services or applications to expose differences and anomalies across time managers and leaders can analyze trends that show how the team has achieved their KPIs, or uncover areas for optimization.
Conclusion
With these new capabilities, your teams can rely on Copilot as their AI assistant to ask and get answers to all your app, network, and device performance questions; use Hosted Monitoring to ensure that no customer or employee suffers from a poor digital experience; visualize trends with Data Explorer to troubleshoot issues, or to quantify IT’s contributions to optimizing digital experience, and, thereby, improve business results.
To learn more about these innovations, watch our webinar, sign up for a demo, and review the latest features today!

Was this post useful?


")

Get the latest Zscaler blog updates in your inbox
By submitting the form, you are agreeing to our privacy policy.